$60K Isn't the Bottom
Every bear market tells the same story. Here's what the data says.

Crypto Super Hub — Weekly Market Intelligence | Mar 15, 2026
Brent crude hit $119.50 on Monday. Dropped to the mid-$70s by Wednesday after Trump said the war was “pretty much complete.” By Friday it was back above $103.
Three wild swings in five days. And every single one driven by a different headline. That’s the problem with trading narratives. Price leads narrative, not the other way around. The stories change every week. The data doesn’t.
The question that actually matters for your portfolio this week isn’t about oil or the Middle East. It’s whether BTC has bottomed. A lot of people think it has. I don’t think the data supports that. Let me show you what I’m seeing.
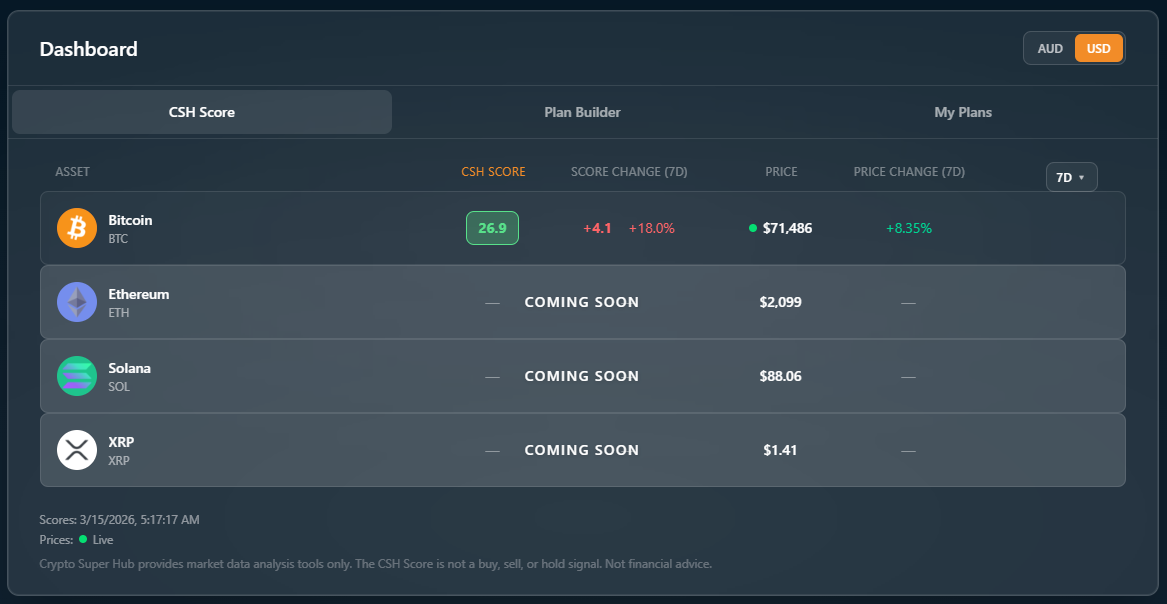
CSH Risk Dashboard
CSH Score: 26.9 / 100 | Accumulation Zone | Direction: Up (+4.1 points, +18.0% over 7 days)
Quick callback. Last week we had BTC sitting at a score of 22, right at the bottom of the accumulation zone. We said conditions were historically favourable for building positions. BTC rallied from $67K to above $71K and the score has jumped to 26.9, still firmly in accumulation territory.
What drove the move? Treasury Secretary Bessent signalled the administration is working to cap oil prices. Trump’s comments about the war being “pretty much complete” briefly pulled crude back to the $70s. Short sellers got squeezed hard. BTC’s 30-day average funding rate has been negative for 14 consecutive days. The longest streak since December 2022, when that same pattern coincided with a local price bottom. Open interest spiked 9% to 700K BTC.
But oil is already back above $103 and climbing, and a short squeeze isn’t a trend reversal.
Key Risk Indicators:
Fear & Greed Index: 15 (Extreme Fear, 38 consecutive days below 25)
BTC Price: ~$71,623 (7d: +7.98%)
BTC Dominance: ~56.8%
Total Crypto Market Cap: ~$2.49T
ETH/BTC Ratio: ~0.029
Jake’s Read: Fear & Greed at 15, and it’s been stuck in extreme fear for 38 consecutive days. The longest streak since the Terra-Luna collapse. For context, the only times it’s been lower in Bitcoin’s history were the COVID crash (8), Terra-Luna (8), and earlier this year when it briefly hit 5. BTC is up nearly 8% on the week, but nothing has fundamentally changed. Oil is back above $103. Inflation is sticky. The Fed is most likely holding rates next week. This bounce has the feel of a bear market rally, not a bottom. The CSH Score history across previous cycles backs that up.
If you have a plan active in the 0-45 range, it should be running. The score has been in accumulation territory for over a month now. That’s significant. But previous cycles spent much longer at these levels before the real turn.
Has BTC Actually Bottomed?
Chaotic week. Oil went from $119 to $76 and back above $103 in five days. Markets whipsawed. Rather than chase every headline, I want to focus on the one question worth answering: where are we in this bear market?
That oil swing does tell us something though. In broader macro cycles, energy tends to be one of the last sectors to spike before things roll over. Oil surging 60% in four months while equities are already under pressure fits that late-cycle pattern. Not a stable backdrop.
But let’s stick to what we know. Our call back in February played out almost perfectly. A low formed in February, BTC pumped into March, currently sitting around $71.6K. The question now: do we dump in April/May like every other bear market year?
A lot of people are calling $60K the bottom. The data says otherwise.
How long has each bear market lasted from the cycle peak to the eventual bottom?
2013-2015: 406 days
2017-2018: 364 days
2021-2022: 365 days
2025-2026: 159 days so far
Never in history has BTC bottomed in February of the bear market year. Not once. The bottom typically forms in Q4, roughly 12 months after the cycle peak. We’re less than halfway through that window.
Now here’s where the CSH Score adds another layer.
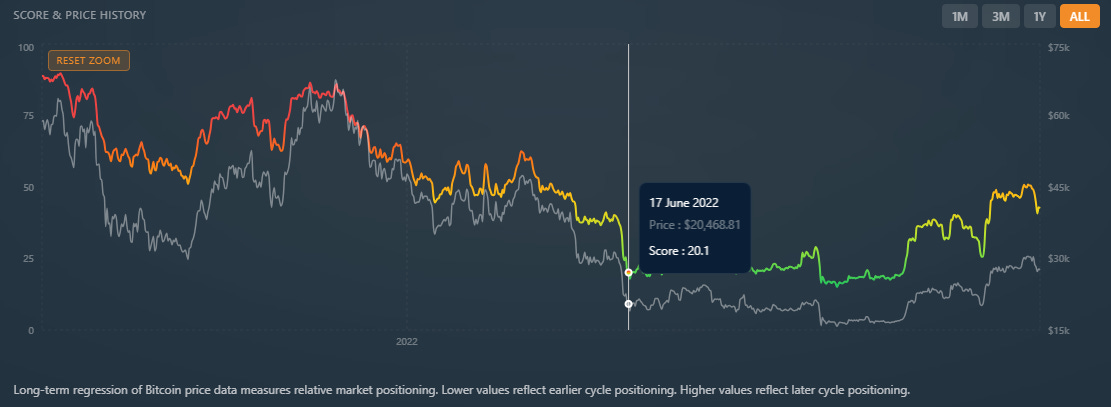
2022: The score first dropped below 20 in June 2022 and stayed in that range for approximately six months. It didn’t break back above 30 until January 2023, when BTC began the next bull run. From that bottom, BTC gained over 700%.
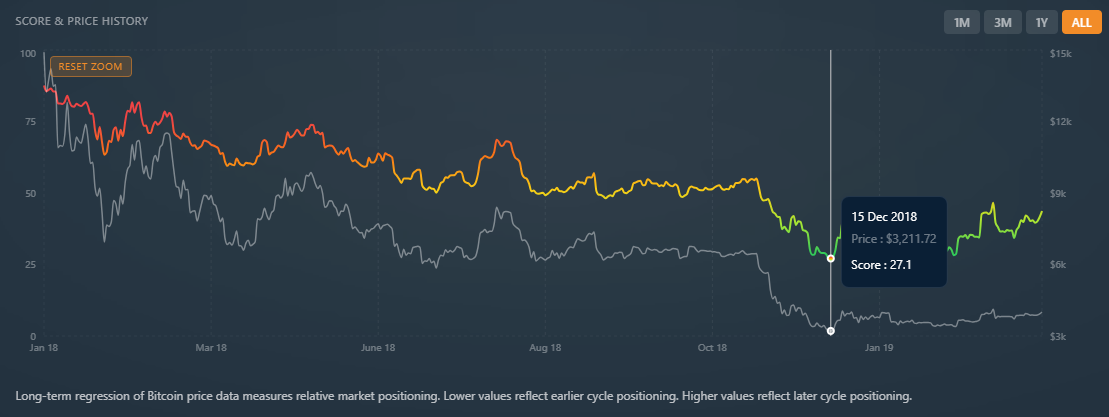
2018: Less severe of a drop. The score hit 27 in December 2018, coinciding closely with the price bottom. Even then, it trended sideways for about three months before breaking above 30 in February 2019. From that bottom, BTC went on to gain over 2,000%.
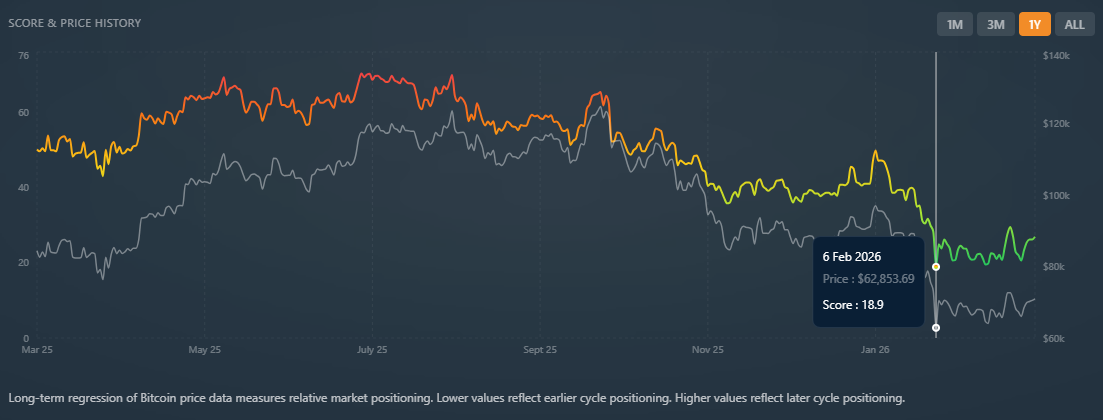
2026: We dropped below 20 in February and have been in this range for about six weeks. Six weeks versus six months in 2022 and three months in 2018. We’re early.
A few things stand out when you compare these cycles:
We’ve dropped to sub-20 score levels much earlier in the year than either 2018 or 2022. Both previous cycles trended sideways in the 20-30 range for three to six months minimum before the bull market resumed. If history repeats on an accelerated timeline, we could see a BTC bottom as early as May to July. If the traditional cyclical view plays out (roughly one year of bear market from the peak) we’re looking at closer to October.
Here’s the part that matters most. Nobody can predict the exact bottom. But the CSH Score is sitting at levels that only come around every four years. And every previous cycle, after the score dropped this low, BTC delivered gains of 700% to 2,000%+ over the following years.
This is the window where plans get built. If yours isn’t in order yet, now’s the time.
Jake’s Workbench
The Skool Community: Week One
We launched the CSH community on Skool this week. Free. No paid tier. No upsell. No signals group.
First week was about foundations. I’ve posted the first CSH Score update inside the community with a walkthrough of what I’m seeing and what I’m doing about it. Tom has been in there answering questions about the Plan Builder. We’ve started uploading the first course modules. The three-step CSH methodology, step by step, plain English.
What people are asking for is the practical “how.” Not theory. “Show me how to set up a plan and what to do when the score moves.” That’s exactly what the courses are built for.
If you haven’t joined yet, it’s free and always will be. The pinned welcome post has everything you need.
Quick Hits
CPI came in at 2.4% for February, matching expectations. Core CPI at 2.5%. Both unchanged from January. The catch: this data was collected before the oil shock. Moody’s chief economist estimates real inflation is closer to 2.7% once you account for the government shutdown data gap from last October. With oil back above $103 and petrol prices up 19% in two weeks, March’s print will tell a very different story. So what: This is the calm before the storm. Energy costs haven’t hit the official data yet. But the Fed sees what’s coming.
Rate cuts are off the table for now. Before this week, markets were pricing a June cut. That’s gone. CME FedWatch now shows the first potential cut pushed back to December, with some traders not pricing another until 2027. The Iran oil shock and sticky inflation killed the easing narrative. Even the two FOMC members who dissented in January wanting a cut will struggle to make that case now. So what: No monetary policy relief anytime soon. The system doesn’t wait for rate cuts. It reads the score.
BTC funding rates negative for 14 straight days. Longest negative streak since December 2022. That last streak marked a local price bottom. Short positioning is heavily elevated and open interest has spiked to 700K BTC. The conditions that drove this week’s sharp rally to $74K? A short squeeze, not a fundamental shift. So what: When everyone’s positioned for down, the snapbacks are violent. Don’t confuse a squeeze for a trend change.
The Week Ahead
FOMC decision lands March 18 at 2:00 PM ET (March 19, 5:00 AM AEST). The hold at 3.50-3.75% is priced in. What actually moves markets at these meetings is the dot plot (how many cuts are FOMC members projecting for 2026?) and Powell’s tone on inflation given the oil shock. History says be careful here: BTC dropped after 7 of 8 FOMC meetings in 2025. In January 2026, it fell 7.3% within 48 hours of the announcement. If you’re leveraged, consider de-risking before. If you’re DCA-ing, the post-FOMC dip has historically been the entry.
Oil is back above $103 and the Strait of Hormuz is still closed. The mid-week dip to $76 lasted less than 48 hours. The Iran conflict isn’t resolved and tanker traffic hasn’t resumed. If the situation doesn’t de-escalate quickly, $120 could come back into play. March CPI will be ugly either way. Watch Brent as closely as BTC this week.
BTC testing $70K-$75K resistance. Up 8% in March. A sustained break above $75K would be the first genuine sign of strength since October. A rejection back toward $65K confirms the bear market rally thesis. The CSH Score at 26.9 says accumulation territory either way.
The Close
Every four years, the CSH Score drops into the 20s. Every time it has, the people who had a plan and stuck to it came out the other side with gains of 700% to 2,000%. We’re in that window right now.
The data says we’re probably early in this bear market. That’s not a reason to panic. That’s a reason to have a system.
Hit reply and tell me: what’s the biggest challenge you’re facing with your crypto portfolio right now? I read every one.
See you next week.
— Jake