Still Early at $79K
The system says yes. The price says no. Here's why I trust the system.

Crypto Super Hub — Weekly Market Intelligence | April 27, 2026
Two months ago I wrote that BTC at $60K wasn’t the bottom. The CSH Score was 22 at the time. Last week Tom and I sat down and ran the numbers backwards across 15 years of Bitcoin data, 112 rolling backtest windows, every entry condition the asset has ever had. The work is dropping as a full X article later this week. Subscribers see the early version first because that’s how this should work.
Then the market moved.
BTC is now $79,228. Up 14% in April. Best month in a year. Sentiment has flipped from “extreme fear” to “we’re back” in about three weeks.
If you only watched price, you’d think we’d left the buy zone behind and the easy money is gone. Most people are reading it that way. Search “is the bottom in” on X this week and you’ll find ten thousand confident takes, all wearing certainty as a costume.
The data tells a different story. Specifically, the data says this rally has the shape of a counter-trend bounce, not a return to the bull market. And it tells us that with one number, in real time, while the rest of crypto is still arguing about it.
CSH Risk Dashboard
Last week we said: the Score had pulled back to 32 with BTC around $74K. The thesis was that the system was still in early-cycle accumulation territory. Plan Builder rule: buy 2× base.
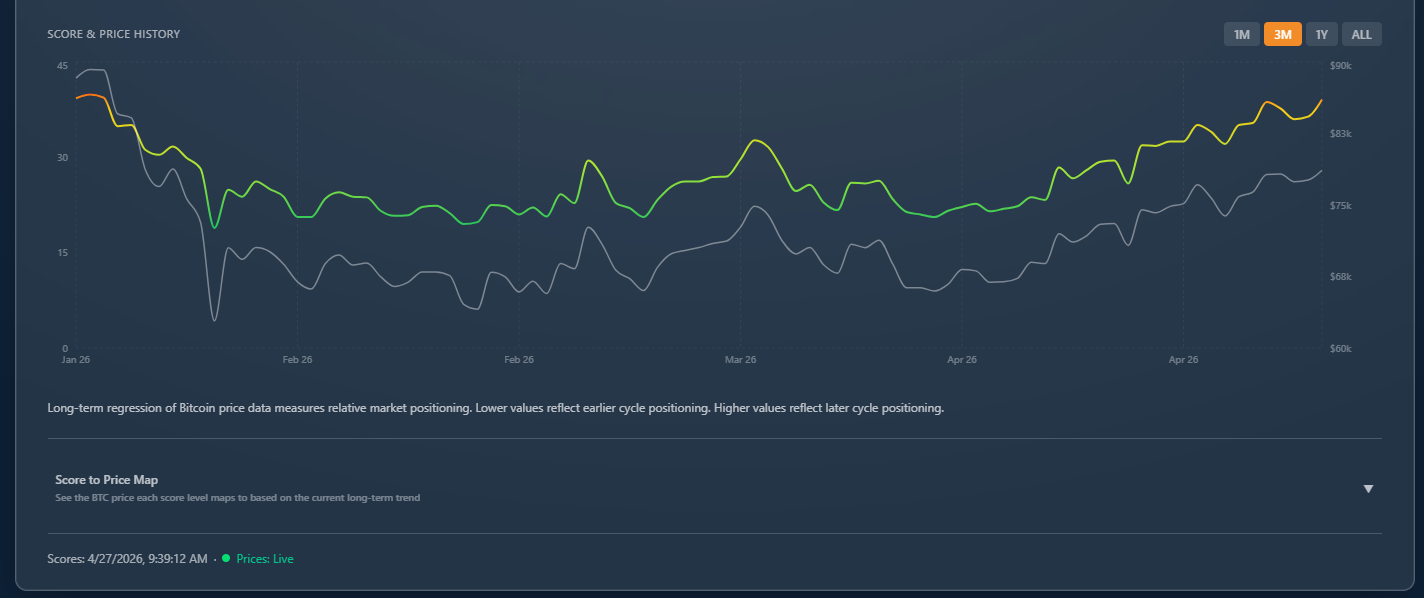
Here’s what happened: BTC ran another $5K higher to $79,228. Score lifted to 36.4. Up 7.1% just this week. Every component of the score moved the same direction: Long-term price position 36.9, Short-term momentum 37.6, Sentiment 33.0.
The number that stops the scroll: the CSH Score is in the bottom 20% of all readings since 2011. Fifteen years of daily data, and we’re sitting in the cheapest fifth.
That’s the data point most price-watchers don’t have. They see $79K and think “expensive, missed it.” The Score says we’re in the cheapest 20% Bitcoin has ever traded in. Both can be true at once because Bitcoin’s “cheap” has gotten more expensive every cycle.
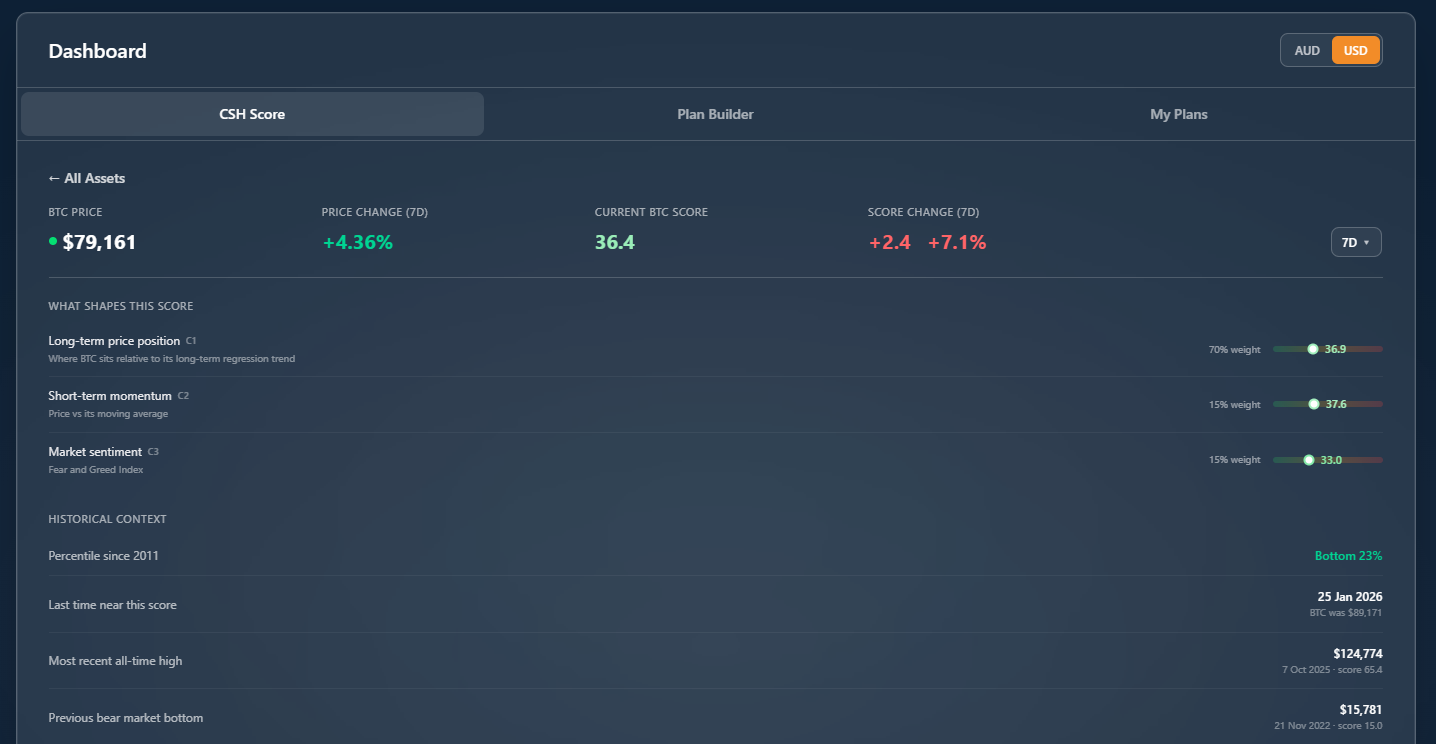
Last time the Score was this low: January 1, 2026 (BTC at $87,520). Below that, you have to go back to the depths of the 2022 bear (Score 15.0 on Nov 21, 2022, BTC at $15,781).
Most recent ATH: Score 65.4 at $124,774 on October 7, 2025.
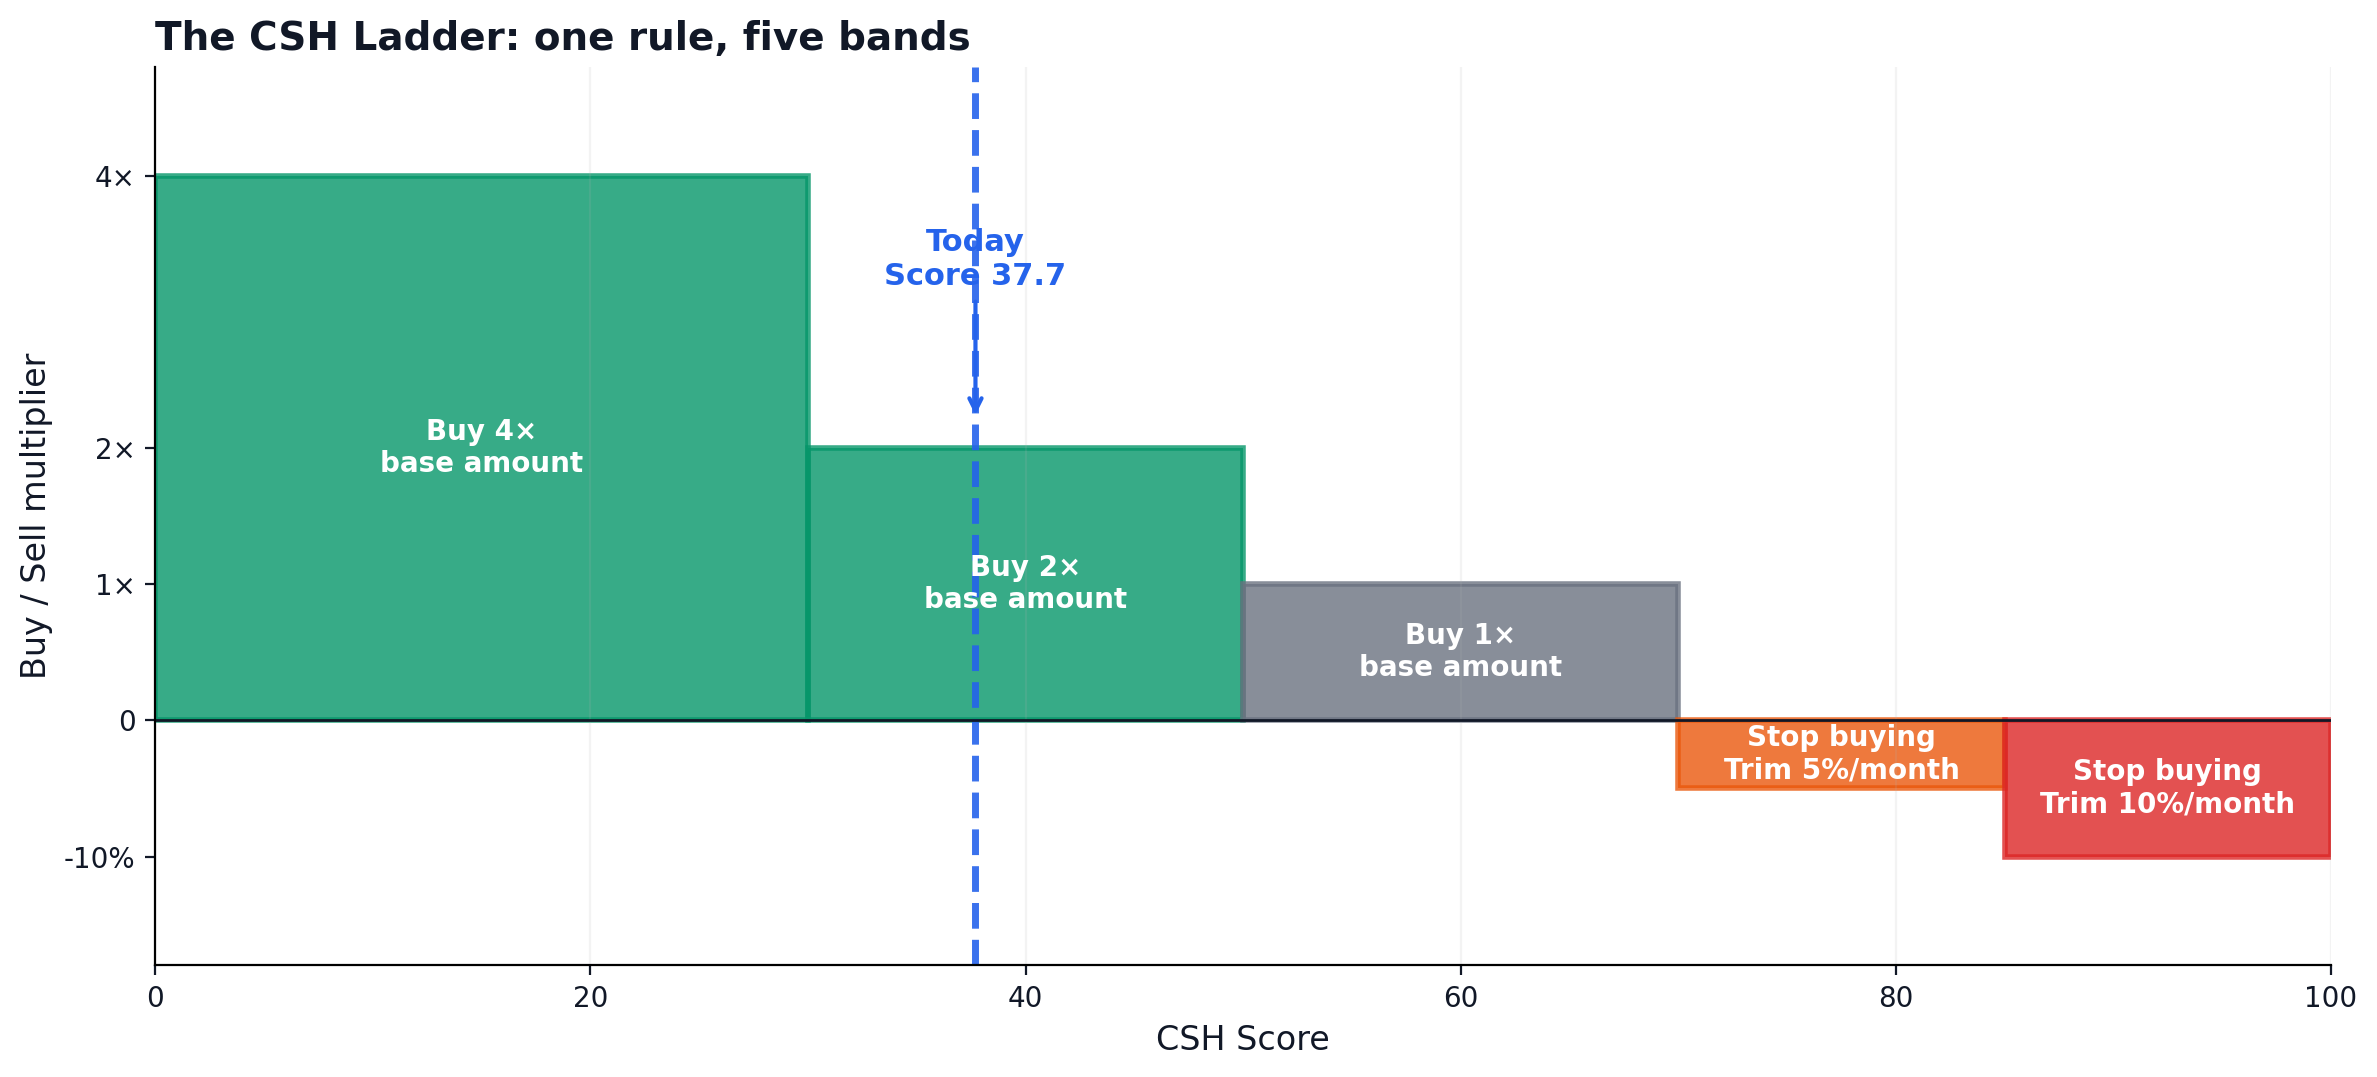
What my Plan Builder does with this: the rule shifts from “buy 4× base weekly” to “buy 2× base weekly.” Same system, different score, different size. No emotion. No bottom call. No top call. Just the next action.
See the live Score and build your own rule on top of it.
The Score Climbs, But the Cycle Doesn’t Lie
Every market call you’ll read this week falls into one of two camps. Either “the bottom is in, we’re back,” or “this is a counter-trend rally and the real low is ahead.” Both camps will sound certain. Both will tell you what to do based on their conviction alone.
The data points one direction.
Every BTC bear bottom in the last decade has spent meaningful time below Score 35. The 2018 bear had a 32-day continuous run, with the Score bottoming at 27.1. The 2022 bear had a 158-day continuous run (more than five months), with the Score bottoming at 15.0. The 2026 bear has so far had a 76-day continuous run, with the Score bottoming at 18.9 on February 6 — and the rally we’re now sitting in just broke that streak.
158 days versus 76 days. The 2022 bear gave you over five months of continuous below-35 buying conditions before the recovery began. We just got two-and-a-half months before the Score broke out into the rally that’s running now.
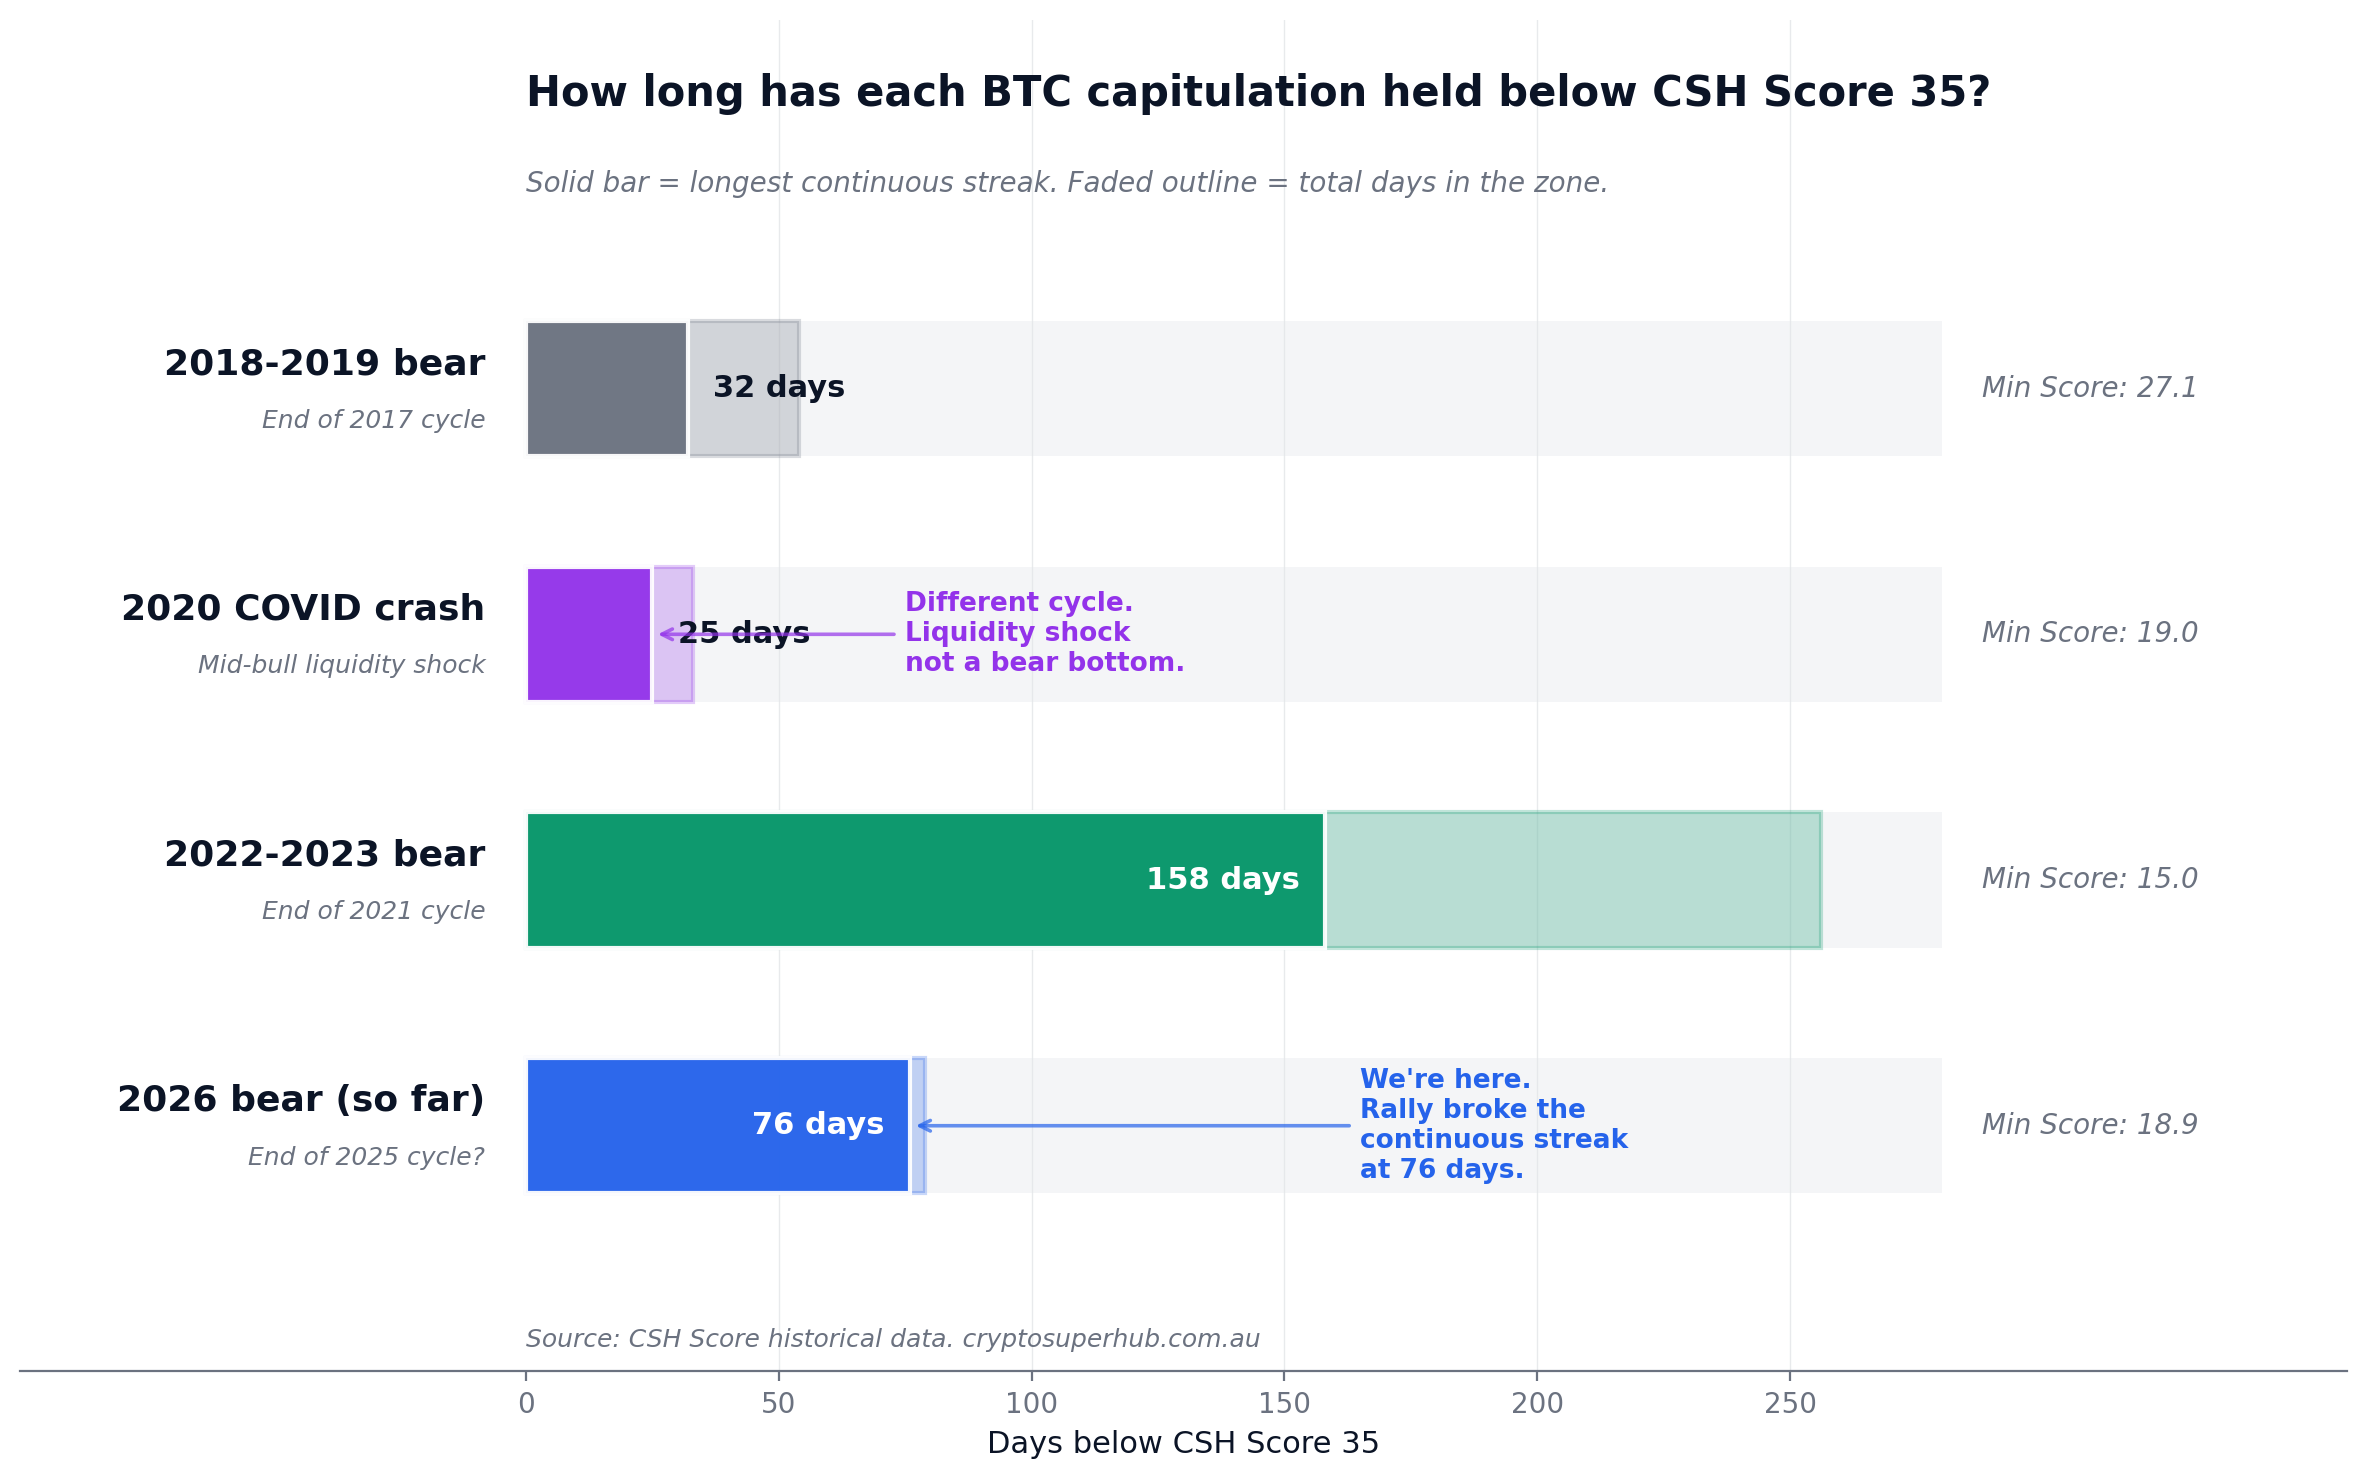
The chart includes one more capitulation worth talking about: 2020. The COVID crash sent the Score from 50 to 19 in twelve days. It looked terrifying. BTC dropped 53% in a week. The Score held below 35 for just 25 days before recovery began. By year-end BTC was at $28K — up nearly 6× from the panic low.
If you were buying that crash, the rule said exactly what to do (4× base buying below Score 30, scaling up to the bottom). It worked.
But 2020 is genuinely different from the bears around it, and that difference matters for how to read 2026. 2020 was a liquidity shock inside an existing bull market. The Score had been climbing through 2019 and was still in mid-cycle territory (50) when the crash hit. There was no preceding distribution phase, no cycle peak to roll over from. Just a sudden macro panic that snapped the Score to capitulation and snapped right back.
2026 is not 2020. The 2025 cycle peaked at $124,774 in October. The drawdown to $62K was 50%. That’s a textbook bear market drawdown following a textbook cycle peak. Whether or not we get more downside, the structure is the same as 2018 and 2022 — not 2020.
Cycles can compress. ETF flows changed how this asset trades. That’s a real factor. But the base case from 15 years of data is that bear bottoms following cycle peaks have lasted longer than 76 days, and counter-trend rallies in those bears have looked exactly like the move we just had — sharp 14% rebound, sentiment flip from fear to confidence, then another leg lower that puts the Score back into the buying zone.
I’m taking the position that this is a counter-trend rally. The data supports it. The cycle compression argument is real but it’s not a base case yet.
But here’s the part that matters more than the call itself. I don’t need to be right about this.
That’s the difference between a market call and a system. A market call requires you to be right. If you call the bottom and you’re wrong, you either chase the rally up or sit out the recovery. If you call the counter-trend rally and you’re wrong, you miss the bull market. Either way, your portfolio depends on your prediction being correct.
A system doesn’t predict. It positions.
If the Score pulls back below 30 in coming months, the rule automatically scales me up to 4× base buying. If the Score keeps climbing past 50, the rule scales me down to 1× base. If the Score crosses 70, the rule stops me buying entirely and starts trimming.
I’ll be wrong about plenty of things between now and the next cycle peak. The system doesn’t care whether I’m right about this rally. It only cares about the next reading and the next action. Same rule worked in 2020. Same rule worked in 2022. Same rule will work whatever 2026 turns out to be.
The trap to watch this week is letting “we’re back” or “we’re going lower” pull you out of your rule. Both predictions feel true at different moments. The system is true at every moment.
The rule was right at $62K. The rule is right at $79K. Same rule, different action, both correct.
Jake’s Workbench
Tom is rebuilding the Plan Builder this month and it’s going to change how the entire app works.
The current version starts with “what do you want to buy and how much.” The new one starts somewhere completely different: “what does your exit look like.”
This is a philosophical change as much as a technical one. Most people building a crypto strategy never plan their exit. They plan their entry, sometimes obsessively, and then improvise on the way out. The 2021 cycle ended this way for thousands of investors, including me. I had a buying plan. I had no selling plan. Then bag rode all the way down and most of it never recovered.
The new Plan Builder forces the exit-first conversation. You define what taking profit looks like before you put a single dollar in. Score thresholds. BTC price levels. How aggressively to trim. What to do with the proceeds.
The full backtest of the rule the new Plan Builder is built around drops as an X article later this week. 15 years of data. 112 backtest windows. The headline number: a Score-aware rule beat Static DCA in 83% of windows tested. Subscribers see the early version. The article goes live Wednesday or Thursday.
Quick Hits
BlackRock IBIT options open interest just topped Deribit. The institutional crypto derivatives market has fully relocated to the regulated US wrapper. So what: the marginal buyer is now an institution with a fiduciary mandate. Different behaviour. Slower to capitulate. Slower to chase.
Tether supply added $5B in April. Total USDT supply now near $150 billion. Stablecoin growth has been one of the cleanest leading indicators for crypto liquidity over the last three cycles. So what: the dry powder is being staged. Whether it gets deployed depends on what comes out of next week’s Fed meeting.
BTC’s strongest month in a year. Up 13.6% in April after five straight monthly declines from October through February — the longest losing streak since 2018. So what: the script flipped fast. Anyone who was waiting for “confirmation of the bottom” is now buying around 25% above the actual bottom. The Score saw this in real time and sized appropriately.
The Week Ahead
FOMC, April 28-29. Powell’s likely last meeting as Chair before Kevin Warsh’s expected confirmation. Market is pricing in another hold at 3.50-3.75%, but the dot plot and post-meeting language matter more than the rate decision. Watch for any softening on the path to cuts later in 2026.
Big Tech earnings, Wednesday and Thursday. Microsoft, Meta, and Google report Wednesday. Apple Thursday. Roughly 20% of the S&P 500 reports this week. Equity volatility tends to bleed into crypto on these prints, especially when the Fed is the same week.
Q1 GDP and March PCE inflation, Thursday. PCE is the Fed’s preferred inflation gauge. Higher than expected pushes rate cuts further out. Lower than expected gives Powell a friendlier exit lane.
Bitcoin 2026 conference, Las Vegas, April 27-29. Three days of institutional speakers, ETF panels, and Code & Country policy discussions. Conference weeks have historically broken compressed ranges in either direction.
The Close
The score moved this week. The plan didn’t. The Ladder did exactly what it was designed to do — same rule, different action, no decisions to second-guess.
Whether the rally extends through May or fades into another leg lower, the system handles both. That’s the entire point.
Full backtest drops on X this week. Subscribers got the heads-up first.
Create your free CSH account and check the Score yourself. Build your own rule on top of it.
— Jake